

Schedule a Consultation
Modern hospital building with a glass curtain wall reflecting a cloudy sky

Healthcare Planning & Access Consulting

Better Planning. Greater Access. Stronger Healthcare.

We help healthcare organizations align community needs, clinical capacity, care delivery networks, and patient access to build more connected and sustainable systems of care.

  1. Understand Demand
  2. Design Networks
  3. Enable Access
  4. Optimize Capacity
  5. Sustain Performance
Access Intelligence Model: population demand, clinical supply, geographic reach, patient experience and financial sustainability combine to shape access HEALTHCARE Access PopulationDemand ClinicalSupply GeographicReach PatientExperience FinancialSustainability

Access Intelligence Model

Five Forces That Shape Access

Access is where five forces meet. Plan for one in isolation and the others become the constraint.

Healthcare Access Landscape

See Where Demand Outruns Access

We layer population, facilities, specialists and drive time into one market view, so access gaps become visible before they become leakage.

Map Layers

Access Opportunity

  • Growth corridor High
  • Specialty coverage Moderate
  • Drive-time gaps Concentrated

Illustrative
Conceptual schematic of a fictional market. It shows how the analysis is layered; it does not depict a real geography or real data. Client engagements use Census population estimates, facility and provider files, and road-network drive-time calculations.

Integrated Planning Capabilities

Six Capabilities, One Planning Model

Each module stands alone. Together they connect demand, delivery, access and economics.

01

Population & Market Intelligence

Demand forecasts from demographics, migration, disease prevalence and utilization trends, down to the neighborhoods where access gaps open first.

Includes
  • Community health needs
  • Age-based utilization forecasts
  • Healthcare deserts
  • Payer mix segmentation
02

Clinical Network & Facility Planning

Ambulatory network, catchment and facility plans that place the right services in the right settings, sized to long-range demand.

Includes
  • Hub-and-spoke models
  • ASC, imaging and infusion networks
  • Clinic location strategy
  • Exam and procedure room capacity
03

Patient Access & Experience

Scheduling, intake, navigation and communications redesigned around the patient journey, from first search to completed visit.

Includes
  • Centralized scheduling
  • Referral intake
  • Waitlist and no-show reduction
  • Patient journey mapping
04

Physician Capacity & Specialty Coverage

Supply-demand models that show where provider panels, APP capacity and retirements will constrain access to specialty care.

Includes
  • Provider-to-population ratios
  • Panel capacity
  • Retirement exposure
  • Care team design
05

Digital Access & Care Coordination

Digital front door, virtual care and referral management that extend reach and keep patients moving through the network.

Includes
  • Telehealth planning
  • Digital self-scheduling
  • Referral leakage
  • Care transitions
06

Access Economics & Performance

Financial scenarios and dashboards that test each access investment for sustainability and track results after go-live.

Includes
  • Site-of-care comparisons
  • Cost-to-serve analysis
  • Capital prioritization
  • Executive dashboards

Healthcare Delivery Network

Design the Network as One System

Every site changes demand on every other. Select a component to see what we plan for.

Hospital PrimaryCare SpecialtyPractices ASCs Imaging Infusion UrgentCare VirtualCare Home-BasedServices

Hospital

The anchor for high-acuity care and specialty depth.

  • Which services must stay inpatient
  • Capacity freed by outpatient migration
  • Transfer and referral flows

Primary Care

The front door for most patient relationships.

  • Panel size and new-patient access
  • Locations relative to population growth
  • Referral alignment with specialists

Specialty Practices

Where wait times are longest and supply is thinnest.

  • Specialty coverage by geography
  • Physician supply and retirement
  • Outreach clinics in satellite markets

Ambulatory Surgery Centers

Procedural capacity outside the hospital.

  • Procedure migration from the hospital
  • Surgeon alignment and capacity
  • Catchment and feasibility

Imaging

Diagnostic access that gates downstream care.

  • Modality mix by site
  • Scheduling turnaround
  • Proximity to ordering providers

Infusion

Recurring treatment where distance matters most.

  • Chair capacity and utilization
  • Drive time to treatment
  • Site-of-care policy exposure

Urgent Care

Unscheduled demand, captured in the right setting.

  • After-hours coverage
  • Emergency department diversion
  • Conversion to primary care

Virtual Care

Reach without a new building.

  • Specialties suited to virtual visits
  • Hybrid scheduling models
  • Reach into rural areas

Home-Based Services

Care that follows the patient home.

  • Post-acute transitions
  • Remote patient monitoring
  • Coordination with the care team

Tip: use Tab and Enter to move through the diagram.

Patient Access & Capacity

Measure Access the Way Patients Feel It

One executive view of availability, capacity and conversion, from first request to completed visit.

Illustrative example — not client or benchmark data

Third-next-available appointment, new patient

24days

Referral completion

62%

Provider capacity in use

93%

Appointment slot utilization

81%

Median specialty wait

38days

No-show rate

14%

Digital self-scheduling adoption

11%

Referral-to-scheduled lag

9days

Wait to Third-Next-Available Appointment, by Specialty

Days, illustrative. Brass marks the access target.

Geographic Access & Network Adequacy

Adequacy Is Measured in Minutes and Miles

Medicare Advantage networks are judged against federal time and distance limits that loosen as counties get less dense. Choose a specialty to compare.

Max time (minutes)Max distance (miles)
  • 90% of beneficiaries in large metro and metro counties must fall within the standard; 85% in micro, rural and CEAC counties.
  • Plans can earn a 10-point credit toward that share for contracted telehealth providers in listed specialties.

Source: 42 CFR §422.116(d)(2), Table 1 (base maximum time in minutes and distance in miles, Medicare Advantage), and §422.116(d)(4)–(5), current e-CFR text as amended through 90 FR 15910 (Apr. 15, 2025); retrieved 16 Nov 2026. CEAC = counties with extreme access considerations (fewer than 10 people per square mile). CMS may raise standards for individual counties by customization, and the annual Health Service Delivery Reference File governs each contract year. Covers Medicare Advantage only; Medicaid managed care and commercial standards are set by states and are not shown.

Clinic building with a curved glass entrance tower

Healthcare Infrastructure & Facility Planning

Infrastructure Sized to Future Demand

Strategic facility planning decides what to build, where and when, before design begins. We size space to demand and sequence capital to need.

  • CapacityExam and procedure rooms sized to forecast volume
  • DistributionSites placed against drive-time coverage
  • Service AllocationWhich services co-locate, and where
  • CapitalInvestment sequenced by need and return
  • Future DemandA long-range view of growth and shift

We work alongside your architects and engineers; we do not provide architectural or engineering services.

Industry-Specific Planning & Access

Planning & Access by Industry

The same discipline, applied to the decisions each type of organization actually faces.

Empty hospital lobby with floor-to-ceiling windows

Hospitals & Health Systems

Align the enterprise ambulatory network with community demand, so services sit where patients need them and the system works as one.

Strategic Priorities

  • Enterprise ambulatory network strategy
  • Service distribution across sites
  • System-wide specialty access

Access Challenges

  • Outpatient volume moving to competitors
  • Fragmented scheduling across facilities
Hospitals & Health Systems →
Quiet clinic corridor with benches, a plant and a wood-slat ceiling

Physician Groups & Specialty Practices

Match provider capacity, clinic footprint and scheduling to specialty demand, so new patients are seen sooner and referrals stay in network.

Strategic Priorities

  • Provider panel and APP capacity
  • Clinic footprint and location
  • Referral network design

Access Challenges

  • Long new-patient lead times
  • Retirement exposure in key specialties
Physician Groups →
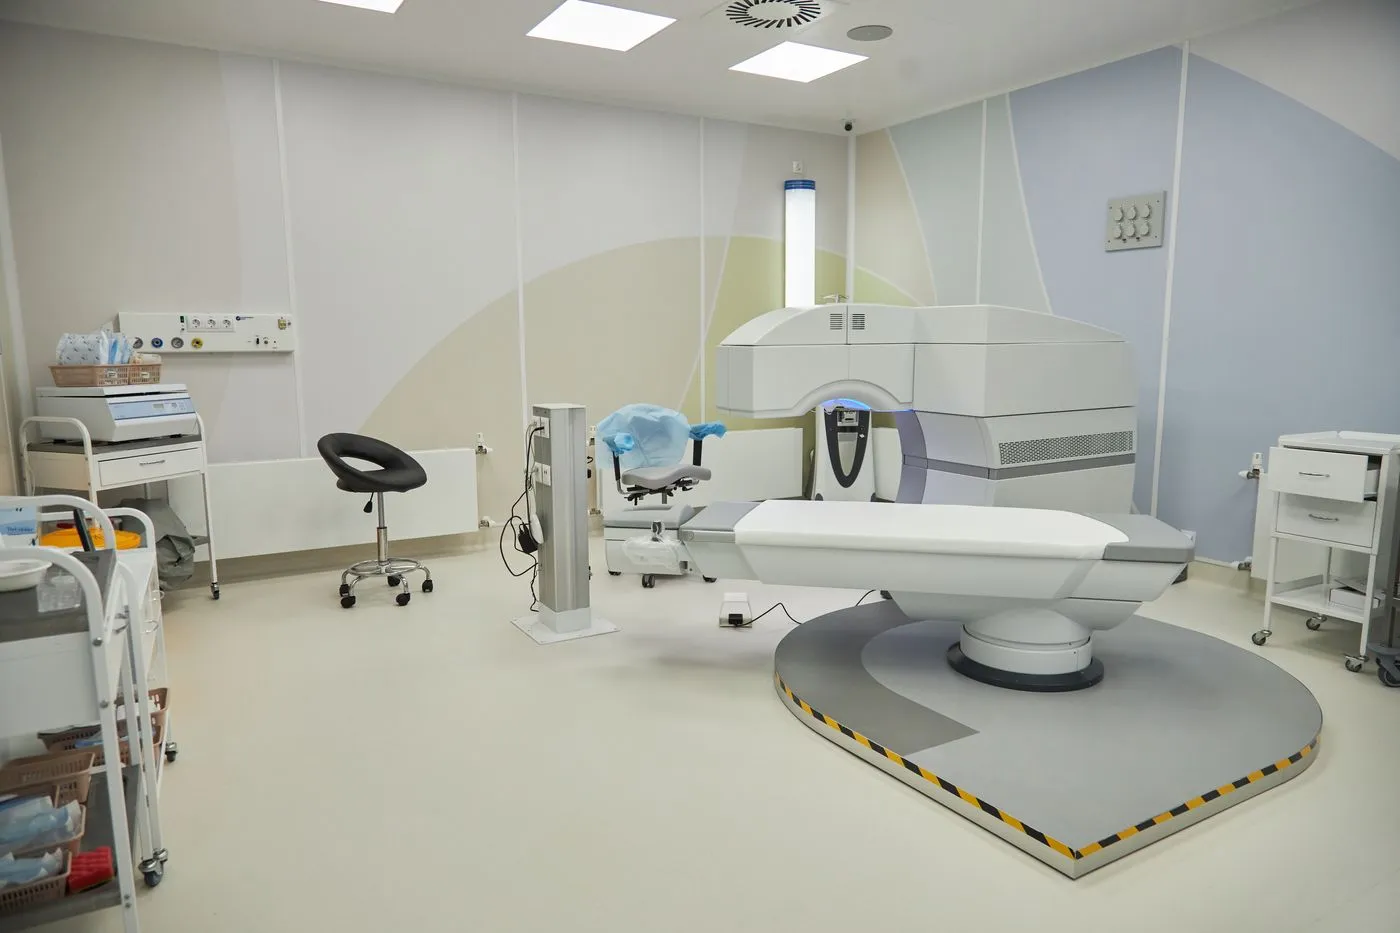
Empty modern procedure room with a treatment table and imaging equipment

Ambulatory Surgery Centers

Test procedure demand, surgeon capacity and catchment before committing capital to a new or expanded surgery center.

Strategic Priorities

  • Catchment and procedure demand
  • Surgeon capacity and alignment
  • Facility feasibility

Access Challenges

  • Volume concentrated in a few surgeons
  • Underused block time
Ambulatory Surgery Centers →
Modern chemotherapy treatment room with recliner chairs and wood-paneled walls

Oncology & Infusion Providers

Plan chair capacity, site of care and referral pathways, so patients reach treatment close to home without delay.

Strategic Priorities

  • Infusion chair capacity
  • Geographic treatment access
  • Referral pathway design

Access Challenges

  • Long travel for recurring treatment
  • Payer-driven site-of-care shifts
Hematology & Oncology →
Night view of North America from space, with city lights forming a network

Health Plans & TPAs

Design provider networks that meet adequacy standards, close specialty gaps and hold up to regulator review.

Strategic Priorities

  • Network adequacy assessment
  • Specialty gap closure
  • Provider directory accuracy

Access Challenges

  • Specialty shortages in rural counties
  • Directories that overstate availability
Health Plans & TPAs →
Glass office building lit from within in the evening

Private Equity & Healthcare Investors

Test whether a platform's access infrastructure and clinical capacity can carry the growth thesis, before and after close.

Strategic Priorities

  • Capacity constraints in diligence
  • Facility network feasibility
  • De novo site selection

Access Challenges

  • Growth plans that outrun provider supply
  • Sites chosen without demand evidence
Private Equity & Investors →

Planning to Implementation

From Analysis to Open Doors

A plan is only useful once it is running. Every engagement moves through five stages.

  1. Baseline demand, supply, access and economics across the market.

    DeliverableAccess assessment and gap map
  2. Forecast demand and test network, capacity and financial scenarios.

    DeliverableDemand and scenario model
  3. Shape the network, sites, staffing and access model.

    DeliverableNetwork and facility plan
  4. Sequence the roadmap, set governance and support launch.

    DeliverableImplementation roadmap
  5. Track access, utilization and financial results against targets.

    DeliverableExecutive access dashboard

Access Economics

Access That Pays Its Own Way

Six drivers decide whether an access investment is sustainable. We test each care setting against all six before capital moves.

  • Clinical demand
  • Provider capacity
  • Facility utilization
  • Payer mix
  • Care-setting selection
  • Capital requirements
Access Investment DecisionSustainable access, not just more access
Conceptual comparison of care settings across access economics drivers
DriverHospital OutpatientFreestanding AmbulatoryVirtual-First Hybrid
Capital intensityHigherModerateLower
Speed to open accessSlowerModerateFaster
Acuity it can serveBroadDefinedLimited
Site-neutral policy exposureHigherLowerEvolving
Reach into thin marketsNarrowTargetedWide
Dependence on provider supplyModerateHigherModerate

Conceptual
Directional framework, not a financial model. Results depend on market, payer mix, service line and regulation, and are modeled for each engagement.

FAQ

Frequently Asked Questions

What Is Healthcare Planning and Access Consulting?

It aligns where care is needed with where and how it is delivered: forecasting demand, designing clinical networks and facilities, improving patient access, and testing whether the plan is financially sustainable.

How Do You Decide Where to Locate a New Clinic or Facility?

We map population demand, existing supply, drive-time coverage, competitor sites and payer mix, then test candidate sites against volume, capacity and financial scenarios before capital is committed.

What Is Ambulatory Network Planning?

Planning the full set of outpatient sites — primary care, specialty, ASC, imaging, infusion, urgent and virtual care — as one coordinated network rather than a collection of individual locations.

How Can We Improve Patient Access Without Adding Providers?

Start with scheduling templates, centralized intake, referral management, no-show reduction and digital self-scheduling. Capacity often exists but is fragmented; we find it before recommending recruitment.

How Do You Analyze Physician Supply and Demand?

We compare provider-to-population ratios, panel capacity, APP deployment and retirement exposure against forecast demand by specialty and geography to show where shortages are likely to emerge.

What Is Network Adequacy, and Who Has to Meet It?

Network adequacy standards require health plans to give members reasonable access to providers. Medicare Advantage plans must meet CMS maximum time and distance standards; Medicaid managed care and many commercial standards are set by states.

How Do You Make Access Investments Financially Sustainable?

Each option is modeled on demand, capacity, payer mix, site-of-care reimbursement and capital, so leaders see the trade-off between access and financial viability before they commit.

Executive Consultation

Build a More Accessible Healthcare System.

Connect population needs, clinical capacity, infrastructure, and financial strategy to create a more effective healthcare delivery network.

Speak With Our Advisory Team →