
Industries We Serve / Ambulatory Infusion Suites
Ambulatory Infusion AdvisoryThe Right Site of Care. Paid What It's Worth.
Payer contracting, drug margin, revenue integrity and growth strategy for infusion suites, infusion centers and the practices and health systems behind them.
Scroll to explore- $65.5BMedicare Part B drug spending, 2024MedPAC, Jul 2026
- 61%Of that spending billed in physician officesMedPAC, Jul 2026
- 281%Commercial price of hospital-administered drugs, as a share of ASPRAND Round 5.1, Dec 2024
- 15Drugs in the first Medicare negotiation cycle to include Part BCMS, Jan 2026
The Site-of-Care Spectrum
Four Places to Infuse. Four Ways to Get Paid.
Payers are moving infusions out of the hospital. Select a site.
Medicare
Hospital outpatient system (POS 19/22). Most drugs at ASP + 6%; 340B-acquired drugs at ASP − 28% from 2027.
Commercial
The highest-priced site. Medicare pays 106% of ASP for the same drugs.
Watch
Payer site-of-care policies now require medical-necessity review for listed drugs infused here.
Medicare
Billed as a physician office (POS 11): drug at ASP + 6% plus fee-schedule administration codes, under physician supervision.
Commercial
Non-340B hospitals received a median 2.44× acquisition cost for the same drugs.
Watch
The 2027 fee schedule conversion factor falls 2.31% to $32.63, pulling administration rates with it.
Medicare
No Part B pathway for the infusion service. The drug may be covered under Part D; nursing and supplies are not.
Commercial
Per diem and nursing codes under the pharmacy's own payer contracts.
Watch
Major commercial site-of-care policies name ambulatory infusion suites as accepted lower-cost sites.
Medicare
Home infusion therapy benefit since 2021, paid to accredited suppliers by drug category.
Commercial
Per diem plus nursing visits, negotiated with the home infusion provider.
Watch
First doses, reaction risk and nursing capacity limit what can safely move home.
RAND RR-A1144-2-v2, Round 5.1 (Dec 2024; 2020–2022 claims, hospital settings). Robinson, Whaley & Dhruva, NEJM 2024;390:338-45 (BCBS commercial claims 2020–2021; independent practices, not infusion centers specifically). CMS CY2027 OPPS (CMS-1850-F) and PFS (CMS-1848-F) final rules, 4 Nov 2026; CMS CY2027 home infusion therapy rates. NICA and NHIA billing guidance. UnitedHealthcare commercial site-of-care policy, effective 1 Oct 2026.
Infusion Economics
The Same Drug, Very Different Prices
Commercial insurers pay hospitals far more than independent practices for identical drug units. That gap is your leverage.
Median Commercial Price as a Multiple of Acquisition Cost
340B hospitals 3.08×, non-340B hospitals 2.44×, independent physician practices 1.12× acquisition cost.
Robinson, Whaley & Dhruva, NEJM 2024;390:338-45, 57 physician-administered drugs, BCBS commercial claims 2020–2021. Acquisition cost = ASP (0.65 × ASP for 340B hospitals).
- +276% to +289%Higher prices at non-340B and 340B hospitals than at independent practices, same drug units.
- 106% of ASPWhat Traditional Medicare pays for most Part B drugs in either setting.
- Your OpeningAn infusion center can price well above its cost and still save the payer money.
Price Your Site-of-Care Offer
See how much room you have below the hospital rate.
How We Help
Five Ways to Strengthen an Infusion Business
Payer Contracting & Site-of-Care Strategy
Rates that reflect the savings you deliver.
- Drug rates indexed to current ASP
- Administration and per diem rates
- Preferred site-of-care designation
- Network entry for new suites
Drug Margin & Buy-and-Bill
Know what every drug earns, by payer, after acquisition cost.
- Margin by drug, payer and NDC
- ASP lag and price-increase exposure
- White, brown and clear bagging strategy
- Biosimilar and formulary economics

Revenue Integrity & Recovery
The drug line carries the dollars, and the leaks.
- Drug units and NDC reconciliation
- Administration code hierarchy
- Prior authorization denial prevention
- Underpayment recovery on drug lines
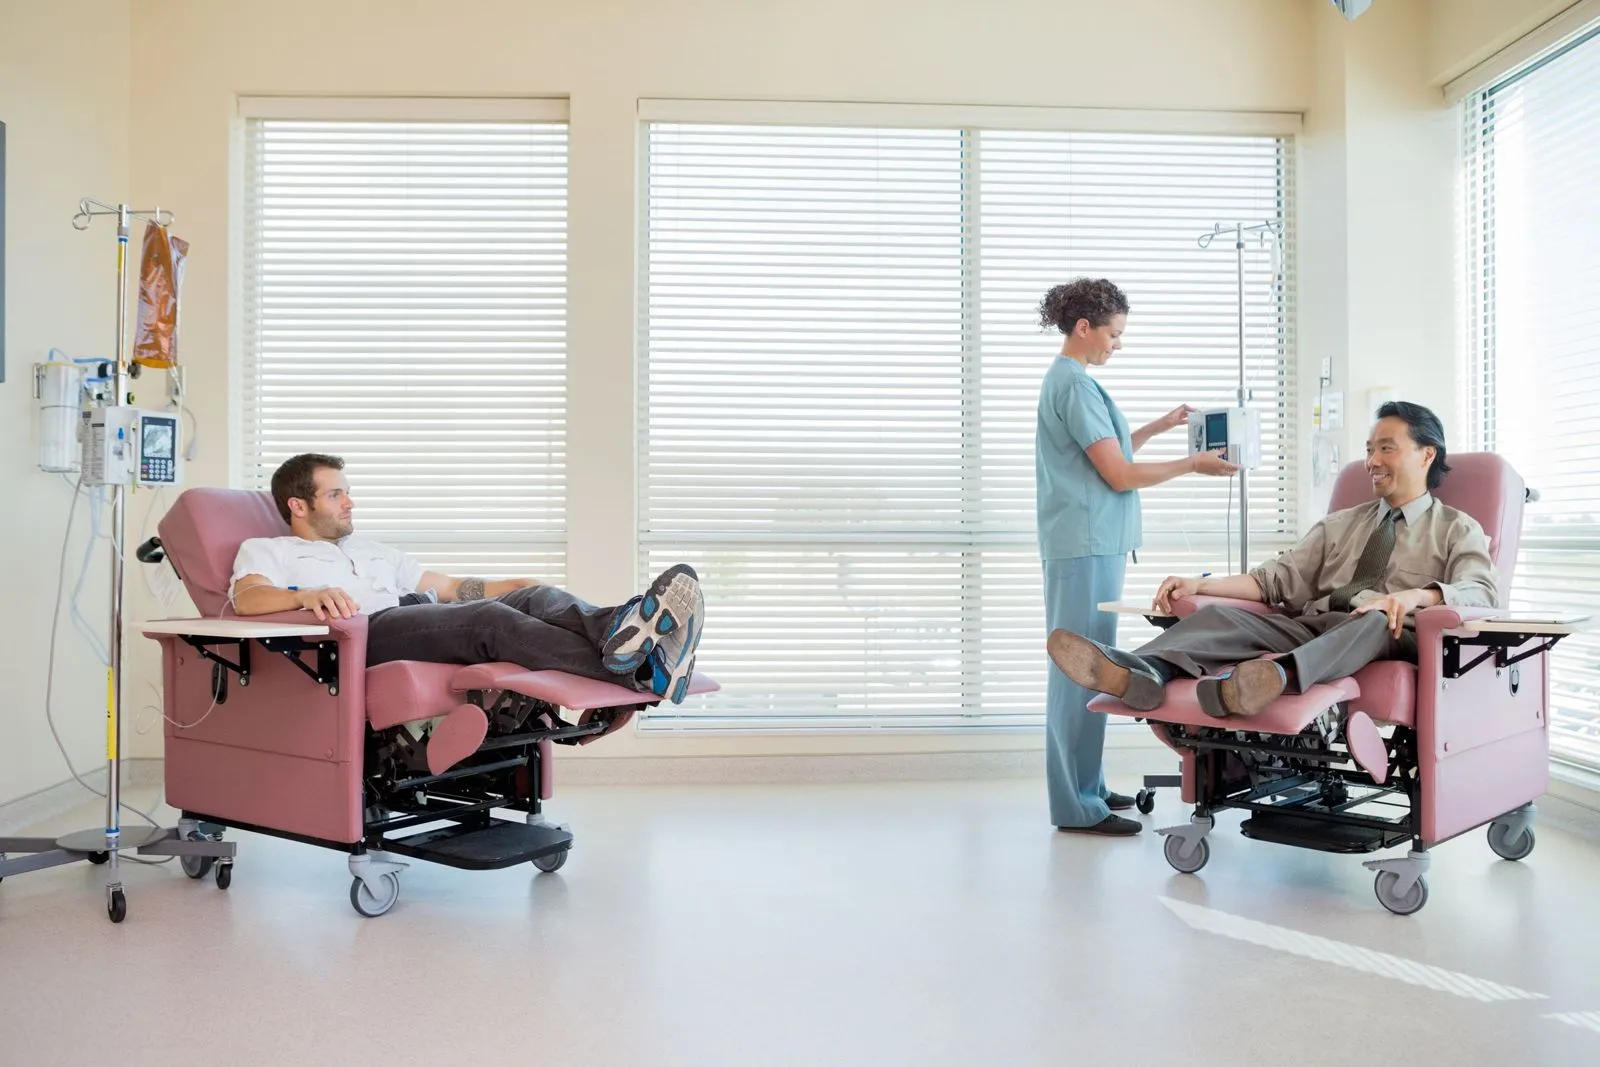
Suite Development & Operations
Open or expand suites where payers, referrals and chair capacity line up.
- Market and feasibility analysis
- Ownership and billing model choice
- Chair capacity and scheduling
- Payer enrollment before opening day

Home & Alternate-Site Strategy
For health systems and practices deciding what moves, where, and on whose contract.
- Hospital-to-office migration planning
- 340B and site-of-care trade-offs
- Home infusion partnerships
- Specialty pharmacy alignment
Infusion Advisory Studio
Model the Infusion Business
Three working models with illustrative defaults. Everything recalculates in your browser.
Payer Cost per Infusion ($K)
Drug and administration cost per infusion, hospital vs. infusion center.
Navy: drug · Brass: administration and facility. Rate headroom = the highest infusion center drug rate (% of ASP) that still costs the payer no more than the hospital. The default hospital drug rate is RAND Round 5.1's average (281% of ASP); every other default is illustrative. Excludes patient cost sharing and pharmacy benefit (bagged) channels.
—
Margin per Dose by Drug ($)
Medicare and commercial drug margin per dose for each drug.
ASP Lag: If Acquisition Prices Rise Before ASP Catches Up
| Acquisition price rise | Annual drug margin | Change |
|---|---|---|
| None | — | — |
Navy: Medicare · Brass: commercial. Medicare pays ASP + 6% (a qualifying biosimilar: its ASP + 8% of the reference product's ASP); sequestration trims 2% from the 80% Medicare pays, leaving roughly ASP + 4.3%. Medicare ASP updates quarterly on sales two quarters old. White-bagged doses earn no drug margin. Excludes coinsurance bad debt, waste, and administration revenue. Illustrative defaults.
Operating Margin by Chair Utilization ($M)
Operating margin at utilization from 40% to 90%.
Capacity = chairs × days × hours ÷ chair time. Operating margin = visits × (revenue + drug margin − variable cost) − fixed cost. Magenta bars are losses. Excludes start-up cost, ramp-up and bad debt. Illustrative defaults.
Your contracts, drug list and claims tell the real story.
Request an Infusion Margin AssessmentPolicy Watch · 16 November 2026
The Rules Reshaping Infusion
340B Drug Payment
Final 2027 hospital outpatient rate for 340B-acquired drugs in non-exempt departments.
CMS-1850-FNegotiated Part B Prices
Part B will pay 106% of the negotiated price for selected drugs, including Orencia, Entyvio and Xolair, from 2028.
CMS; SSA §1847AGLOBE Model
A mandatory CMS test of an international-benchmark Part B rebate in about a quarter of the country, from 2027.
CMS, Sep 2026Bagging Limits
States banning payer-mandated white and brown bagging, as of August 2025.
AMAHow Each Site Gets Paid
The billing model decides who can contract, and for what.
| Hospital Outpatient | Office-Based Center | Pharmacy-Based Suite | Home | |
|---|---|---|---|---|
| Medicare claim | Hospital outpatient system (POS 19/22) | Physician fee schedule (POS 11) | No Part B infusion pathway | Home infusion therapy benefit |
| Medicare drug | ASP + 6%; 340B at ASP − 28% | ASP + 6% | Part D, where covered | Pump-delivered drugs, plus a per-day service payment |
| Commercial | Highest prices | Negotiated % of ASP plus administration | Per diem plus nursing | Per diem plus nursing |
Sources: CMS CY2027 OPPS final rule fact sheet (4 Nov 2026); CMS IPAY 2028 selected drugs (27 Jan 2026), with Part B status per CMS HCPCS listings; CMS GLOBE Model (30 Sep 2026); AMA State Advocacy Update (1 Aug 2025); CMS place-of-service code set; NHIA and NICA billing guidance; CMS home infusion therapy benefit. Commercial terms vary by contract.

Our Approach
From Drug List to Stronger Contracts
A 90-day assessment, then a 12- to 18-month contracting and performance cycle. Select a phase.
Contract inventory, payer mix and a drug list priced by NDC and payer.
Rates against ASP, payer site-of-care policies and local hospital pricing.
Site-of-care offer, rate targets and a position on bagging for each payer.
Payer negotiations, preferred-site designations and network entry.
Drug-line payment audits, quarterly ASP updates and recovery.
Illustrative 18-month workplan.
Illustrative workplan. Timing and outcomes depend on each organization.
Infusion Revenue Check
Where Is Your Infusion Margin Leaking?
Twelve questions with sample answers filled in. Change them to yours. Scored in your browser; nothing is stored or sent.
Score by domain.
Your Infusion Revenue Summary
Answer the questions to build your summary.
A self-assessment for discussion, not an audit. Scoring: Yes 2, Partly 1, No or not sure 0, equally weighted.
Fulcrum Intelligence
Perspectives on Infusion
Infusion & Specialty Drug Economics in 2026
2026 Commercial Payer StrategyDefending the Infusion Margin
Aug 2026 Underpayment & Payment IntegrityRecovering the Drug Line
Aug 2026Questions, Answered
What Is an Ambulatory Infusion Suite?
An ambulatory infusion suite is a non-hospital setting for infused and injected drugs. The industry separates office-based infusion centers, which bill like a physician office, from pharmacy-based suites, which bill like home infusion. We advise both, and the health systems that run their own.
How Does Medicare Pay for Drugs in an Infusion Center?
Office-based centers bill Medicare as a physician office. Most separately paid drugs are paid at ASP plus 6%, and administration is paid under the physician fee schedule. Medicare has no separate infusion-center provider type.
What Is White Bagging?
White bagging is when a payer's specialty pharmacy ships the drug to the infusion site, so the site administers but does not buy or bill the drug. Brown bagging sends it through the patient; clear bagging uses the provider's own specialty pharmacy.
What Are Payer Site-of-Care Programs?
Site-of-care programs require review before certain drugs are infused in a hospital outpatient department, steering stable patients to offices, infusion suites or home. Approval for the hospital setting is typically time-limited.
How Do Biosimilars Affect Infusion Margin?
Medicare pays qualifying biosimilars their ASP plus 8% of the reference product's ASP, while biosimilar competition pushes reference prices down. Margin depends on each payer's rate and the acquisition cost of each product.
How Will Medicare Drug Price Negotiation Affect Infused Drugs?
The 2028 cycle is the first to include Part B drugs. For selected drugs, Medicare will pay 106% of the negotiated price, which changes the drug margin for those products from 2028.

Get Paid for the Value Your Infusion Site Delivers
Payer contracting, drug margin and site-of-care strategy, from one senior team.